joshua’s research

Sunday, November 4th, 2012

Banda Aceh: Resilience 2004


The Indian Ocean Tsunami of 2004 struck the coast of Sumatra only 45 minutes after the initial seismic activity.  Because the people of Western Indonesia were unaware of the relationship between earthquake, and its subsequent tsunami, they were completely taken by surprise when 15-meter waves struck the coast of Sumatra’s largest city.  The results were horrific.  Nearly 170,000 people died in the region.  Moreover, the city was leveled due to poor construction techniques that were not meant to withstand the force of such enormous waves.  This low-level building resilience is common in Southeast Asia, and became a serious liability when the tsunami struck Thailand, Sri Lanka, India, and Indonesia.


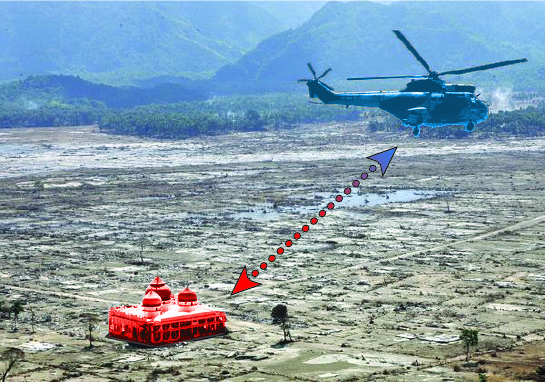
Across the Tsunami-stricken zone, religious institutions became important landmarks of resilience.  Banda Aceh is an extreme case in that the Grand Mosque was the only building to survive the tsunami within miles of its impact.  It is important to note that while it did survive, the resilience was not necessarily embedded in disaster prevention.  In fact, the resilience of this particular mosque can be attributed to prevailing cultural values – the mosque is a social catalyst, and the most important symbolic structure in the city.  As such, its construction is undertaken with the utmost care and materials.  It is meant to withstand time, not water.  But it did survive water, and was converted into a vital temporary shelter.


The photograph above reinforces my previous post – that access and relief effectiveness are intrinsically linked.  Military and NGO relief was restricted to one mode of transportation for nearly a week – the helicopter.  Communication between victims and the outside became purely visual.  What had worked so well in Galle, Sri Lanka, where mosques around the city became an informal relief network, was completely interrupted in Banda Aceh.  The symbiosis between observer and faith-place was severed, resulting in chaos and lack of communication, whereas in Galle order was maintained and casualties where minimized.
Sunday, November 4th, 2012

Neural Network Mapping: Analysis from Above


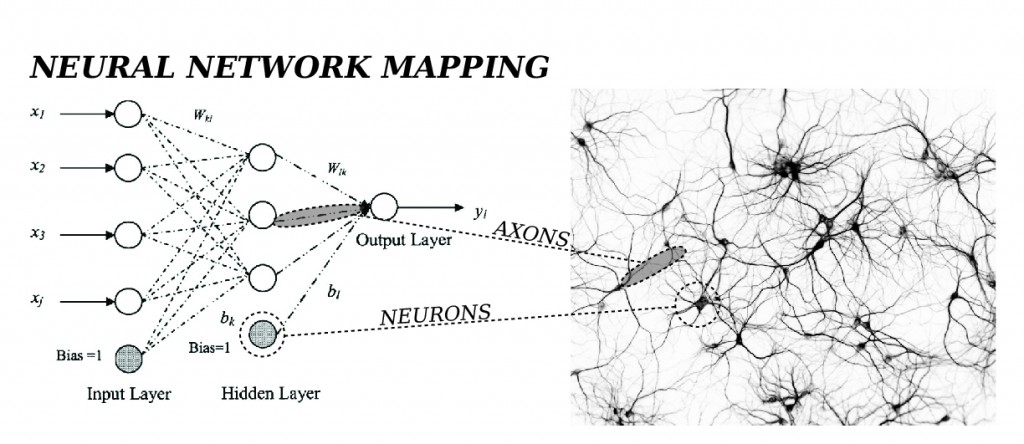
Though phase 1 of Final Project has come to an end, it’s worth mentioning the neural network, as compared to its synthetic partner: the artificial neural network.  Neural networks encompass a system of pattern recognition used by the human (and animal) brain.  As opposed to a feedback loop, neural networks behave according to a feed-forward loop.  That is to say, an input enters the neural system, is processed by a “background layer” of neurons, and sent along to an output layer: the action.  Though this seems like a fairly simple algorithmic procedure – a series of if-then statements – the speed at which the biological neural network processes inputs is astonishing, and perhaps in-replicable by machines.

Most important is that neural networks are adaptive.  The success of the output action is weighted by neurons and new links are created.  The network learns .  It is easy to see why this would be an appealing science to recreate.  Given our knack for reducing biological processes down to computer code (for better or worse), the ability for a network to adapt, to improve on its failure, is potentially very powerful.  It has, in fact, crept up in more recent cases of natural disasters.

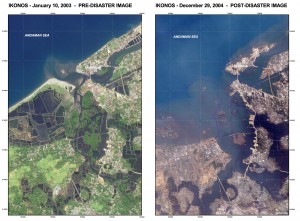
KONOS and ZKI (The Center for Satellite-based Crisis Information) ran before and after images of Banda Aceh, Indonesia through an artificial neural network.  Devastated by the 2004 Indian Ocean Tsunami, one can clearly see the absence of coastal terrain in the after-image.  The neural coding attempts to analyze the before-image – to understand where roads, highways, houses, schools are located.  By establishing these loci through patterns in image pixelation, ZKI’s code can assess what parts of the city are cut out.  It learns where there were once roads, and where there was once shelter.  With over 90% accuracy, one can know prior to entering the territory, the most efficient route to a particular destination.


Monday, October 15th, 2012

Anarchical Networks

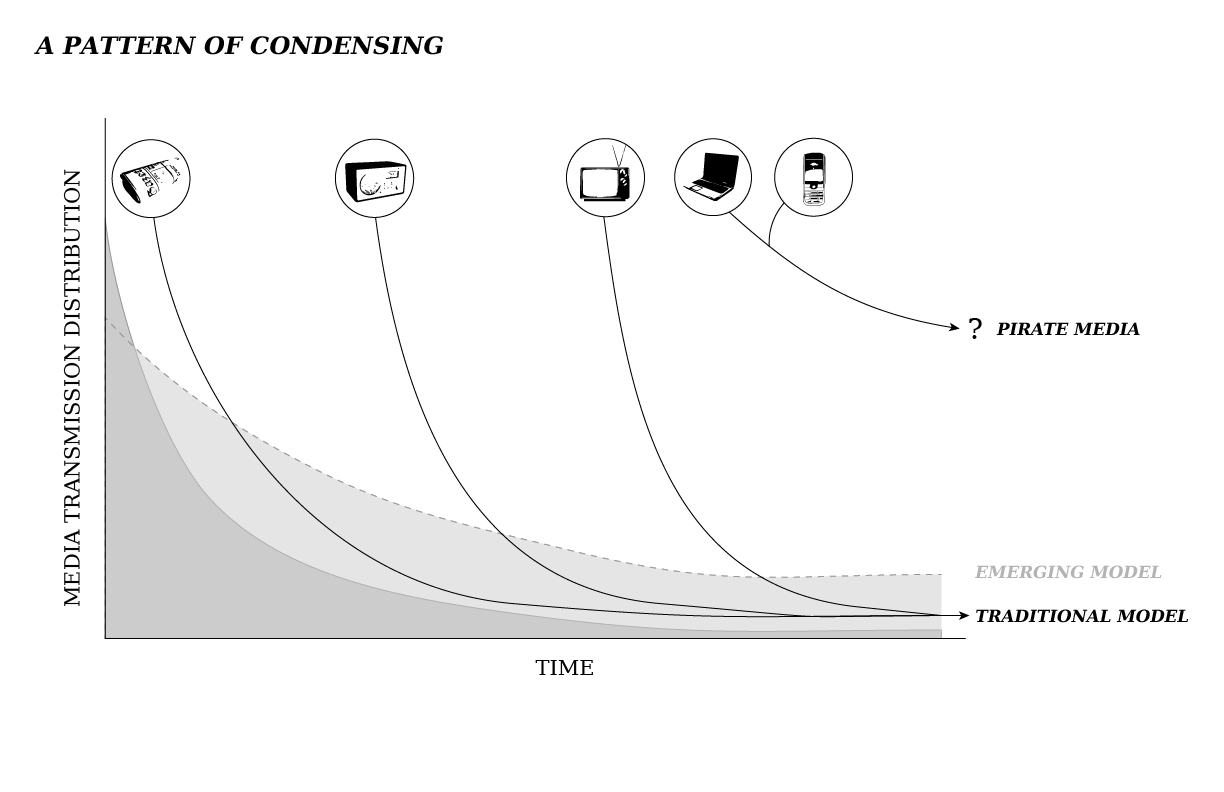
I think this is my most telling diagram from the analysis phase.  It also feeds my suspicions: I suspect the corporate model of being self-aggrandizing, of loving itself too much, but mostly of being greedy.  Yochai Benkler, in The Wealth of Networks, discusses the pattern of media condensation.  Over time, the transmission of information, from a media’s inception, becomes more and more exclusive.  The number of transmitters decreases, and consequently so does the number of opinions.  Who is to blame?  Well, Marx would blame all of us for participating in this capitalist system.  We ascribe value to everything – including knowledge!  So is knowledge gained from CNN more valuable than knowledge gained from Twitter?  Only insomuch as the value of knowledge depends on its source.  The purpose of Twitter-ian knowledge is noble, however.  Benkler advocates the public sphere, a discourse meant to enlighten all.  Democratize the news!  Let us all take part!  Like the forums of ancient Rome, we can decide for ourselves what is credible.  Or at least, we can make our own soapbox.


Monday, October 15th, 2012

Graph Theory or: How I Learned to Love 7th Grade Math

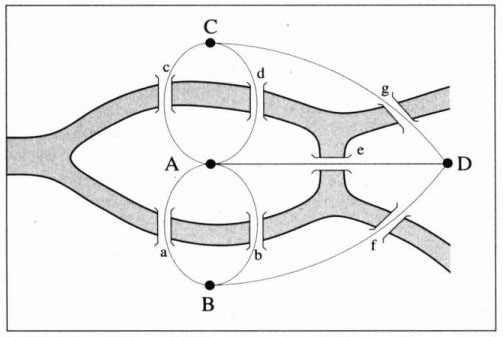
Strange as it may sound, the study of networks began for me in 7th grade with geometry and algebra.  Little did I know the Konigsberg Bridge problem would reappear in my life in a more meaningful way 15 years later.  It is interesting to think of this problem as being fundamental in the way we now graph network typologies: nodes and edges.  But beyond pure representational techniques, this problem represents an early venture into abstraction.  To reduce places and routes – physical things – down to mere points and lines is fundamental in understanding other abstract concepts like: efficiency, connectivity, the small-world effect, etc.  Philip Ball expands on this in Web Worlds , that this system of representation can be extended to diagramming natural phenomena (fluvial) as well as the man-made (telephony, electrical grids).  Surely, graph theory is one of the first layers of the anthropocene – an indelible mark left on the earth, by us.  Thanks to Leonhard Euler, the author of the Konigsberg Bridge problem, biological and synthetic can be understood in the same visual language.


All content © Copyright 2025 by CLOUD Reassembly RPI.
Subscribe to RSS Feed – Posts or just Comments

Powered by WordPress
Designed by Graph Paper Press